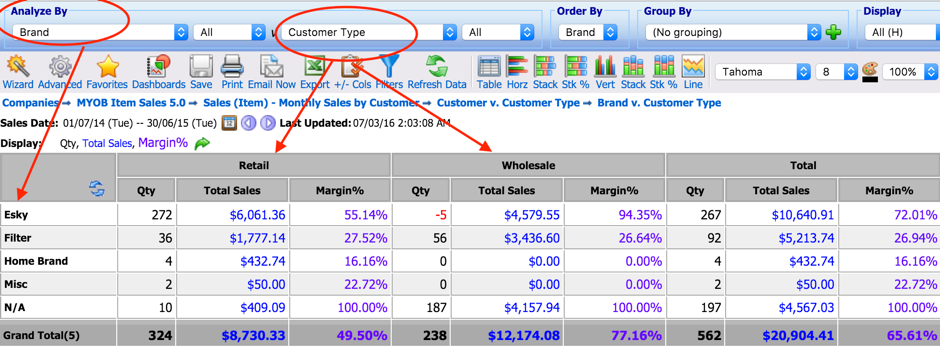
If you have hundreds of Customers or Items and are drowning in detail you will find it difficult to understand your margin mix or spot trends in your business.
It is easy to Categorise your Customers and Items into similar groupings within your accounting package then use BI4Cloud to find out early when issues arise.
Items
Our clients categorise their Items by Brand, Product Type (e.g. Parts v Finished Goods), Wine Variety (e.g. Chardonay v Shiraz) or Product Use (Diesel v Petrol).
Customers
I have seen clients categorise their Customers by Buying or Franchise Group, by Distribution channel (Direct v Wholesale v Online) or by Customer Type (Restaurants v Schools).
The key thing is to understand what are the key drivers of your business. If you have different margins for one Brand to another then being able to report on Sales and margins over time by each Brand will help you to better understand how each Brand contributes to your bottom line. Is one Brand constantly being discounted to move product, are marketing campaigns resulting in increased overall gross profit and not just increased sales?
Salespeople need this higher level sales data to identify gaps they can fill e.g. Customers or Customer Types only buying some not all of your Brands or Product Types.

Click Here to learn how to use Custom Lists in MYOB to categorise Customers and Items. Then use BI4Coud to report on them. Find out how easy it is to:
- Group by – to Subtotal Items by Product Group
- Analyze by – to see Brands as a Row dimension
- Filter – to focus on just one Customer Buying Grouping
- Pivot – to show Customer Type as Columns
- Visualize – to bring the numbers to life in a chart
- Compare – to track variances from prior periods


Comments are closed.